Pulse — Analytics Dashboard
A real-time analytics workspace that turns dense product data into clear, confident decisions.
01 — Context
The challenge
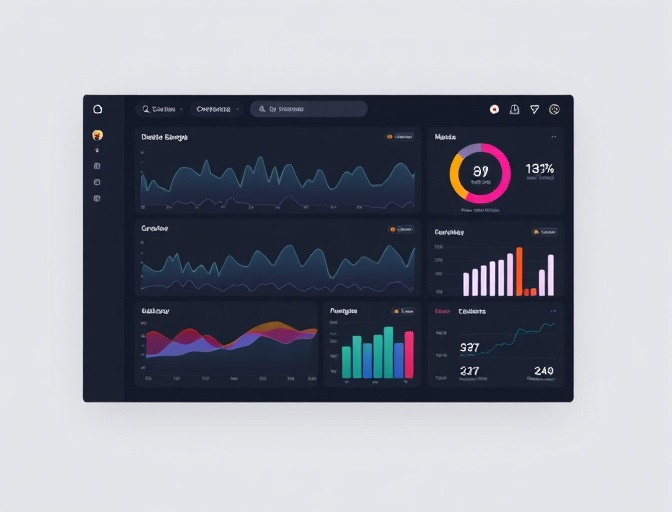
A focused analytics dashboard concept built around a question product teams ask every day: what changed, why, and what should we do next? The interface pairs a calm visual system with fast, keyboard-friendly exploration.
Product teams often collect more data than they can use. Exports pile up, metrics live in different tools, and the numbers that matter are buried under noise. The concept brief was to design a single workspace where a product team could scan performance, investigate a change, and leave with a next action.
02 — Approach
The solution
I shaped the experience around three layers: a live overview, a focused investigation view, and a lightweight notes layer for decisions. The build uses a small set of reusable chart and card primitives, a shared data contract, and URL-driven filters so every useful view can be shared or bookmarked.
03 — Build
What I built
Live overview
Configurable KPI cards with trend context and a compact activity stream.
Investigation view
Filterable time-series charts, cohort comparisons and drill-down panels.
Decision notes
A lightweight layer for capturing what the team learned and what happens next.
Shareable state
URL-driven filters make every view reproducible and easy to discuss.
04 — Result
What the build demonstrates
- A dashboard that stays readable across dense time-series data.
- Reusable chart primitives instead of one-off screens.
- Shareable filter state with sensible defaults and empty states.
- A responsive layout that keeps primary actions within reach.
“The most useful design constraint was refusing to show every available metric at once. The dashboard earns its space by making the next question obvious, not by displaying more data.”
Project reflection
Next step
Have a project like this in mind?
Tell me what you're trying to make. I'll reply with an honest view of the work and the next useful step.